


Trago Realty Monthly Newsletter
Chester County Real Estate Insights
April 2025 • Issue #1
Welcome to your monthly guide to Chester County, PA real estate trends, school district updates, and subject matter expert topics from Trago Realty.
Now that the month of March has concluded, we bring you a comprehensive look at:
Subscribe to our monthly newsletter today to stay informed, and to receive April's market updates in our upcoming issue.
Please also feel free to share this valuable resource with anyone who might be interested in Chester County real estate!


This month's report provides a comprehensive overview of the county's active housing market. This report dives into key metrics including average and median sale prices, days on market, and financing trends, offering valuable insights for anyone looking to understand, and/or navigate, the Chester County real estate market.

The data highlights key metrics such as total rentals, average rent price, and average Cumulative Days on Market (CDOM), offering insights into the current dynamics of the rental landscape across different areas.

In this report, we’ll break down essential market indicators such as median and average sales prices, sale price-to-original price ratios, and financing trends. The market remains dynamic, with a limited number of financing options. Additionally, transaction details are organized by township to offer a deeper understanding of market activity.

In this report, we'll delve into the key statistics that define the current market, including average and median prices, inventory levels, and financing trends. We've also compiled a comprehensive list of closed transactions, organized by township, to provide you with a detailed overview of recent sales activity.

In this report, we'll delve into the key statistics that define the current market, including average and median prices, inventory levels, and financing trends. We've also compiled a comprehensive list of closed transactions, organized by township, to provide you with a detailed overview of recent sales activity.
Policy & Regulation

April is recognized as National Fair Housing Month—a time to reflect on the ideals of fairness and equal access to housing. At the time this blog post was written in 2025, federally, there are seven protected classes under the Fair Housing Act: race, color, national origin, religion, sex (including gender identity and sexual orientation), familial status, and disability.
One area that may deserve more exploration is age. Under current Pennsylvania law, individuals under the age of 40 may not be protected from housing discrimination based solely on age. This raises an interesting question:
Should adults aged 18 and older be protected under state law in the same way those 40 and older are?
Especially when it comes to housing access for college students and young renters, this question might become even more relevant.
Market Observations

The old adage “Location, Location, Location” is a fundamental truth in real estate. Of course it would be, right? After all home’s location is fixed—it doesn’t change.
In this case, all of the properties analyzed are within Downingtown Borough, meaning their location is relatively the same. However, location alone doesn’t determine price. Condition is the key variable, and as the sales featured illustrate, it can cause significant differences in price—even between nearly identical homes.
Stay updated with the latest Chester County market trends, school district insights, and perspectives from a subject matter expert.
Trago Realty is a client-centric, real estate sales and leasing firm based in Chester County, PA. We help bring your personal dreams, business visions, and investment goals to life through the spaces. With a hyper-focus on the heart of Chester County, PA in the market service areas of Downingtown, West Chester and Coatesville School Districts, and their surrounding communities, our brokerage offers personalized service backed by local insight.
Our Mission: We prioritize your interests, not our bottom line.
Our Approach: Listen. Inform. Execute.
Our Values: We want what’s best for you.
Facebook Instagram LinkedIn TikTok Threads X
Have questions about Chester County real estate?
Call us at (610) 563-3330 or email hello@tragorealty.com

This report provides a snapshot of the rental market in select school districts within Chester County, PA, for the month of March 2025. The data highlights key metrics such as total rentals, average rent price, and average Cumulative Days on Market (CDOM), offering insights into the current dynamics of the rental landscape across different areas. Understanding these trends can be valuable for both prospective tenants and landlords in this region. To understand how these trends impact your real estate goals, call Trago Realty today for a personalized consultation.
________________________________________
Avon Grove Area School District
________________________________________
Coatesville Area School District
________________________________________
Downingtown Area School District
________________________________________
Great Valley School District
________________________________________
Kennett Consolidated School District
________________________________________
Octorara Area School District
________________________________________
Owen J. Roberts School District
________________________________________
Oxford Area School District
________________________________________
Phoenixville Area School District
________________________________________
Spring Ford Area School District
________________________________________
Tredyffrin-Easttown School District
________________________________________
Twin Valley School District
________________________________________
Unionville-Chadds Ford School District
________________________________________
West Chester Area School District
________________________________________
• https://www.tragorealty.com/#subscribe

The Chester County rental market in March 2025 demonstrates a diverse landscape influenced by location. The data from these select school districts reveals significant differences in rental activity, pricing, and the time properties remain on the market. This initial overview highlights the localized nature of rental trends and the importance of considering specific areas when assessing the market to achieve your goals, whether it be to live in a specific location, to purchase an investment property, rent out your property as opposed to selling or timing the sale of an investment property.
*All information in this report has been collected from Bright MLS and is deemed reliable but not guaranteed. The Broker makes no representations or warranties, express or implied, regarding the accuracy, completeness, or reliability of the data provided. This information is subject to errors, omissions, and data entry inaccuracies, including but not limited to those from cooperating brokers participating in Bright MLS. Additionally, this report does not account for off-market transactions, private sales, or transactions conducted outside of Bright MLS.
This report is for informational purposes only and should not be construed as real estate advice. Individual circumstances vary, and real estate decisions should be based on professional guidance tailored to your specific situation. Please contact Trago Realty or your real estate agent to discuss your particular situation and/or needs.
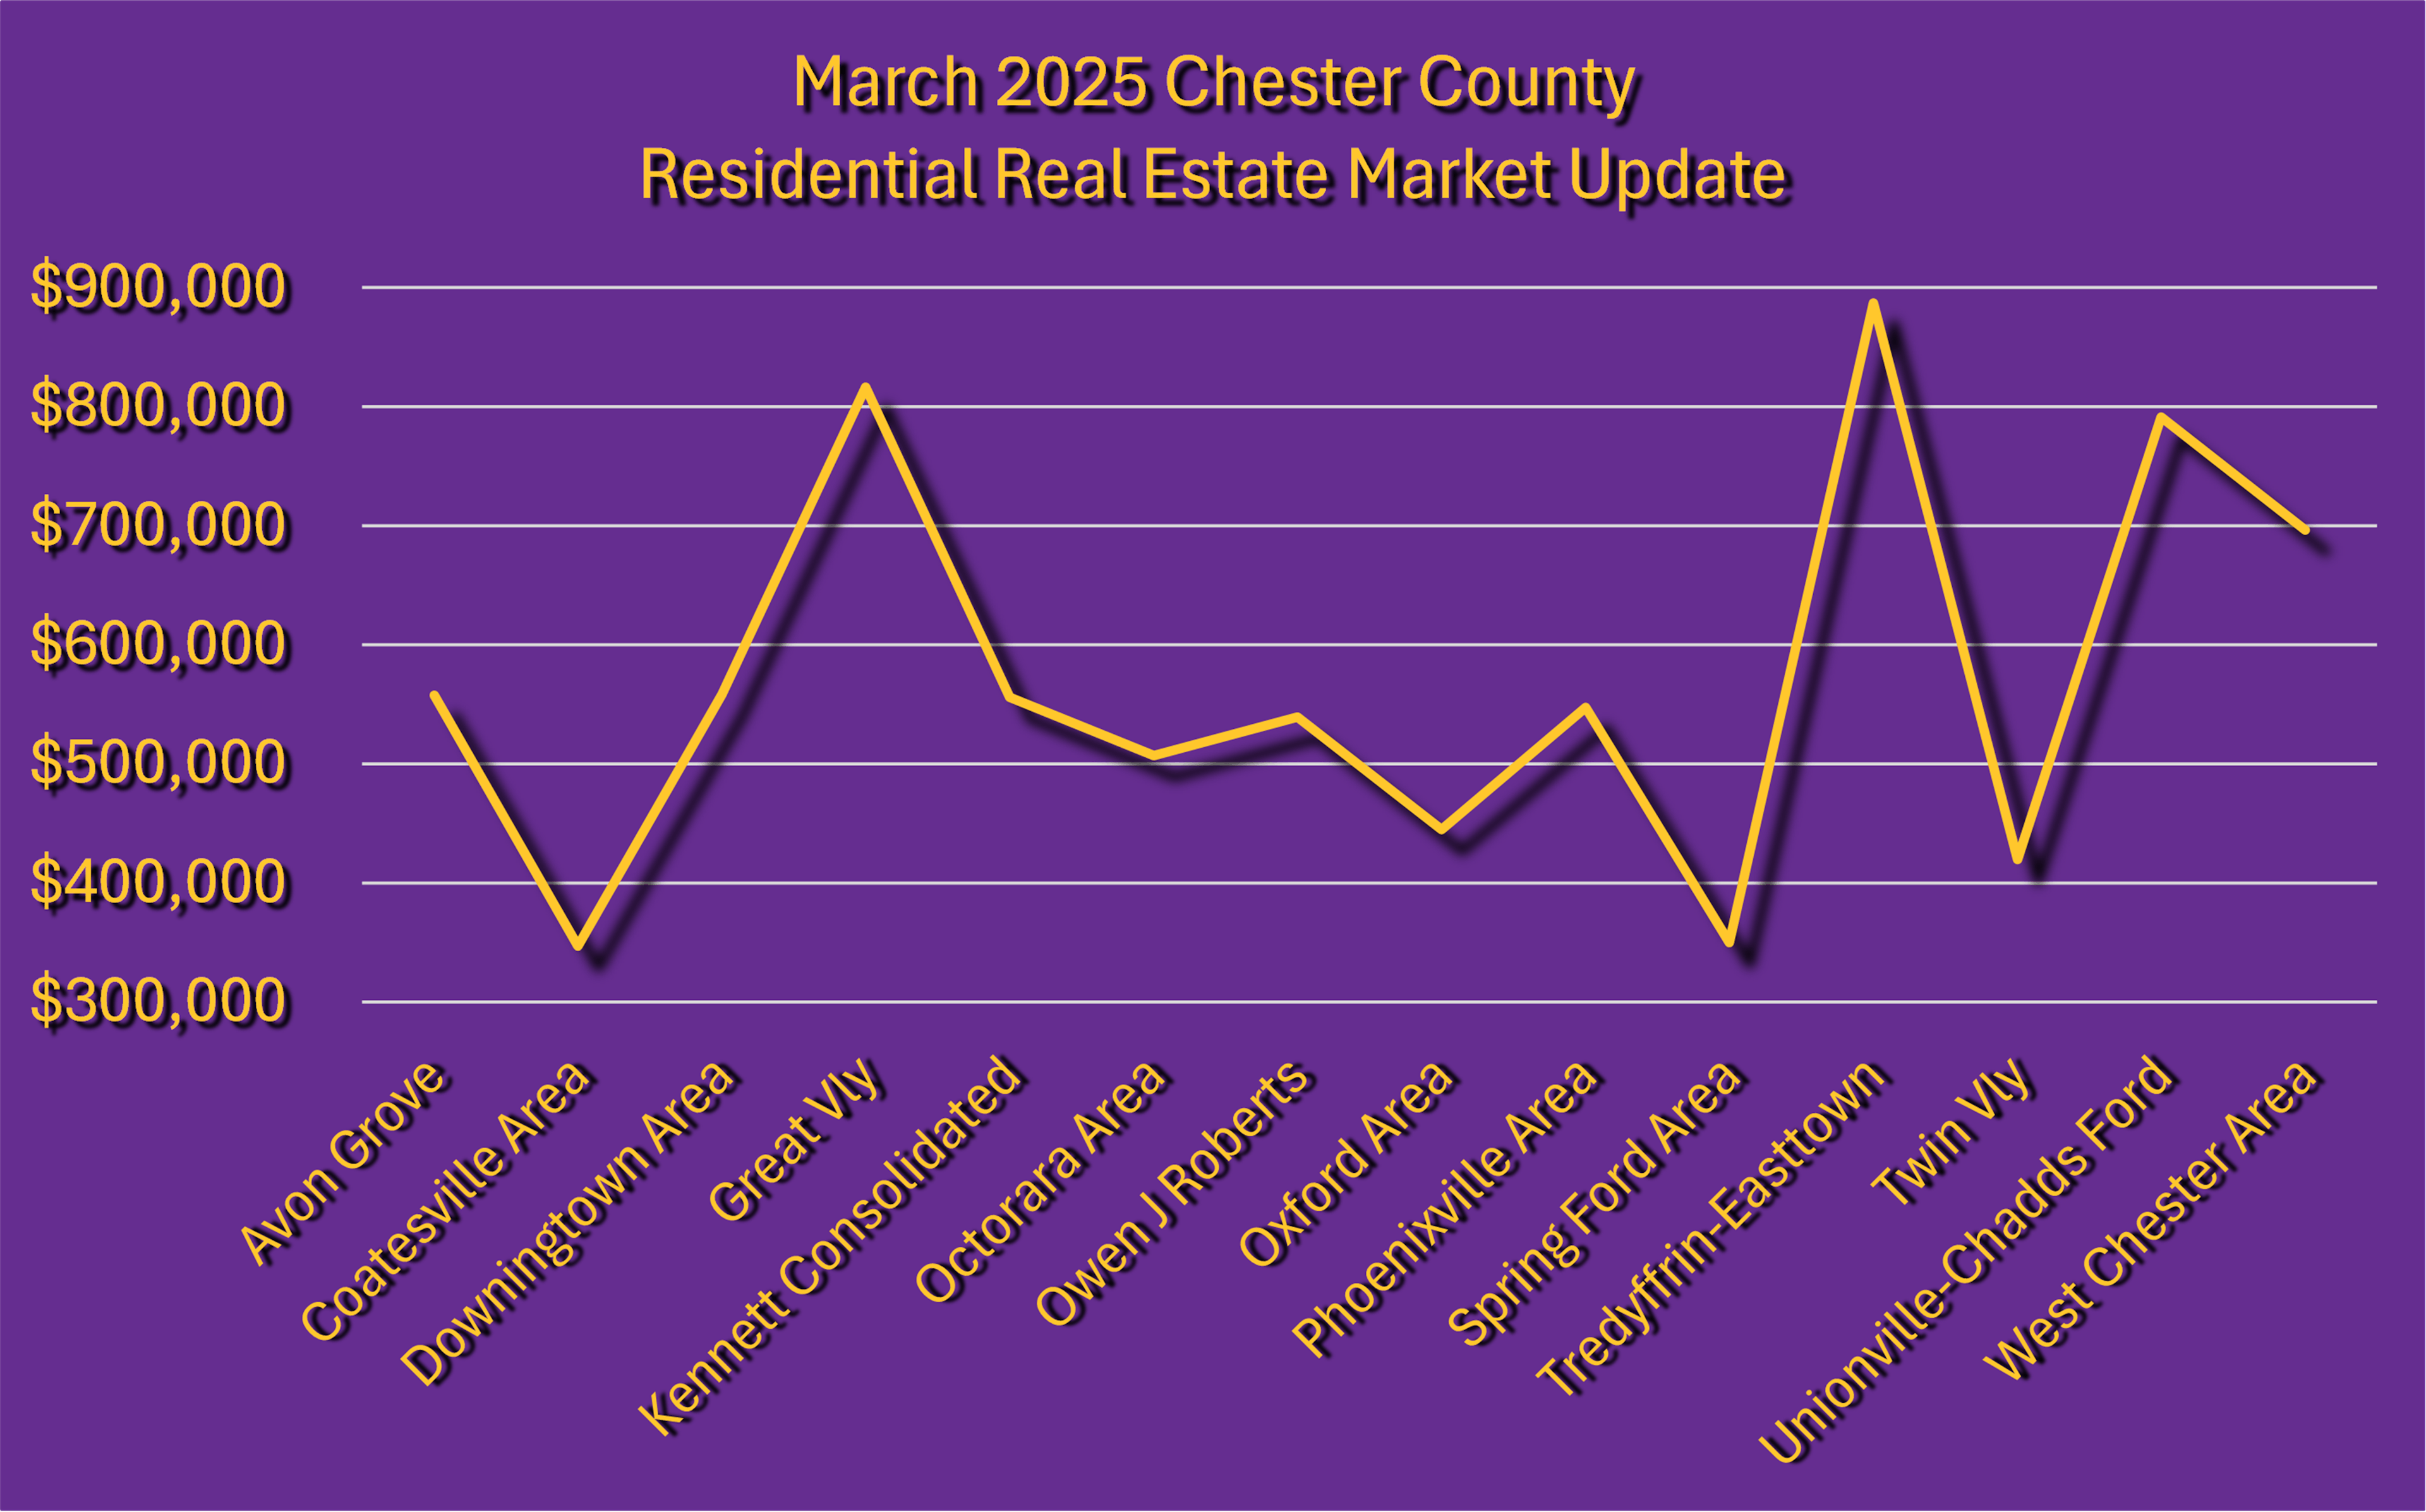
Welcome to the March 2025 Chester County Real Estate Market Update! This month's report provides a comprehensive overview of the county's active housing market. We're seeing a trend of homes selling quickly, with a median of just nine days on the market, indicating strong buyer demand. While most homes sold near their asking price, strategic pricing remains crucial, as price reductions were a factor in many transactions. This report dives into key metrics including average and median sale prices, days on market, and financing trends, offering valuable insights for anyone looking to navigate the Chester County real estate scene. Explore the details below to understand the dynamics of this sellers' market and how it might impact your real estate goals. To understand how these trends impact your real estate goals, call Trago Realty today for a personalized consultation.
March 2025 Chester County Real Estate Market Report: Key Data Points
Here's a straightforward look at the Chester County Residential Real Estate Market activity for March 2025, based on the latest data:
• Current Price Average: $833,078
• Current Price Median: $625,000
• Months Supply of Inventory: 3 months
• Sale Price-to-Original Price Ratio: 100.75%
• Days to Sell Average: 24 days
• Days to Sell Median: 6 days
• Cumulative Days on Market Average: 27 days
• Cumulative Days on Market Median: 6 days
• Number of Price Reductions: 150
• Reduced Price-to-Original Ask Ratio Average: 93.72%
• Reduced Price-to-Original Ask Ratio Median: 95.64%
• Number of Closed Sales: 369
Mortgage & Payment Types (March 2025):
• Adjustable Rate Mortgage: 0.27%
• Cash: 28.46%
• Conventional: 65.04%
• Exchange Trade: 0.27%
• FHA: 2.44%
• Other: 1.36%
• PHFA: 0.54%
• Private: 0.27%
• VA: 1.36%
Key Observations:
• Both the average and median sale prices saw significant increases from February to March.
• The supply of available homes decreased further, indicating tighter inventory.
• Homes sold at a slightly higher percentage of their original list price on average.
• The time it took for homes to sell decreased, with the median dropping to just 6 days.
• The number of closed sales increased substantially, reflecting a more active market.
Average Sold Price: $416,597
Sold Price-to-List Price: 96.43%
Cumulative Days on Market: 35
🟢 Franklin Twp (1 Sale): $400,000 | 88.89% | 6 days
🟢 London Britain Twp (1 Sale): $461,000 | 102.67% | 4 days
🟢 London Grove Twp (1 Sale): $387,500 | 96.90% | 40 days
🟢 New London Twp (3 Sales): $468,333 | 88.77% | 69 days
🟢 Penn Twp (7 Sales): $394,608 | 99.83% | 28 days
Average Sold Price: $344,065
Sold Price-to-List Price: 99.35%
Cumulative Days on Market: 28
🟢 Caln Twp (14 Sales): $423,354 | 99.88% | 35 days
🟢 Coatesville City (8 Sales): $205,113 | 100.31% | 11 days
🟢 E Fallowfield Twp (4 Sales): $373,725 | 96.79% | 65 days
🟢 Sadsbury Twp (5 Sales): $416,050 | 100.89% | 46 days
🟢 South Coatesville Boro (2 Sales): $347,500 | 102.99% | 6 days
🟢 Valley Twp (16 Sales): $331,431 | 100.63% | 18 days
🟢 West Brandywine Twp (7 Sales): $280,286 | 94.52% | 42 days
🟢 West Caln Twp (6 Sales): $371,521 | 98.21% | 17 days
Average Sold Price: $602,300
Sold Price-to-List Price: 101.61%
Cumulative Days on Market: 21
🟢 Downingtown Boro (5 Sales): $327,060 | 104.11% | 7 days
🟢 E Brandywine Twp (10 Sales): $684,792 | 97.15% | 31 days
🟢 E Caln Twp (5 Sales): $493,500 | 99.07% | 40 days
🟢 U Uwchlan Twp (5 Sales): $859,700 | 100.81% | 33 days
🟢 Uwchlan Twp (9 Sales): $571,056 | 102.68% | 6 days
🟢 Wallace Twp (2 Sales): $900,950 | 116.22% | 3 days
🟢 West Bradford Twp (5 Sales): $526,200 | 104.11% | 24 days
🟢 West Pikeland Twp (1 Sale): $475,000 | 98.96% | 6 days
Average Sold Price: $824,308
Sold Price-to-List Price: 102.56%
Cumulative Days on Market: 42
🟢 Charlestown Twp (4 Sales): $1,358,935 | 100.46% | 71 days
🟢 E Whiteland Twp (10 Sales): $648,904 | 102.78% | 16 days
🟢 Malvern Boro (4 Sales): $682,500 | 103.10% | 15 days
🟢 Willistown Twp (4 Sales): $870,000 | 103.58% | 107 days
Average Sold Price: $641,028
Sold Price-to-List Price: 96.15%
Cumulative Days on Market: 38
🟢 E Marlboro Twp (3 Sales): $570,333 | 101.16% | 59 days
🟢 Kennett Square Boro (1 Sale): $312,120 | 113.50% | 11 days
🟢 Kennett Twp (1 Sale): $722,528 | 97.32% | 45 days
🟢 New Garden Twp (3 Sales): $553,625 | 86.86% | 15 days
Average Sold Price: $382,214
Sold Price-to-List Price: 104.60%
Cumulative Days on Market: 27
🟢 Atglen Boro (2 Sales): $363,000 | 109.53% | 7 days
🟢 Highland Twp (1 Sale): $353,000 | 105.37% | 3 days
🟢 Londonderry Twp (1 Sale): $505,000 | 95.30% | 155 days
🟢 Parkesburg Boro (2 Sales): $389,500 | 104.12% | 7 days
🟢 West Sadsbury Twp (1 Sale): $312,500 | 104.20% | 4 days
Average Sold Price: $612,537
Sold Price-to-List Price: 100.26%
Cumulative Days on Market: 34
🟢 E Coventry Twp (4 Sales): $582,725 | 96.03% | 35 days
🟢 E Vincent Twp (4 Sales): $619,172 | 101.75% | 34 days
🟢 N Coventry Twp (2 Sales): $570,000 | 98.14% | 113 days
🟢 S Coventry Twp (1 Sale): $410,000 | 109.33% | 7 days
🟢 Warwick Twp (2 Sales): $519,000 | 100.67% | 8 days
🟢 West Vincent Twp (3 Sales): $801,667 | 102.01% | 5 days
Average Sold Price: $456,594
Sold Price-to-List Price: 104.14%
Cumulative Days on Market: 21
🟢 E Nottingham Twp (6 Sales): $545,067 | 111.31% | 22 days
🟢 Elk Twp (2 Sales): $570,500 | 104.11% | 4 days
🟢 Lower Oxford Twp (5 Sales): $510,138 | 98.89% | 30 days
🟢 Oxford Boro (2 Sales): $280,000 | 104.17% | 6 days
🟢 West Nottingham Twp (2 Sales): $120,000 | 95.71% | 30 days
Average Sold Price: $449,553
Sold Price-to-List Price: 99.87%
Cumulative Days on Market: 36
🟢 E Pikeland Twp (6 Sales): $572,417 | 101.45% | 21 days
🟢 Phoenixville Boro (20 Sales): $451,952 | 99.97% | 41 days
🟢 Schuylkill Twp (3 Sales): $187,833 | 96.03% | 27 days
Average Sold Price: $395,833
Sold Price-to-List Price: 101.85%
Cumulative Days on Market: 31
🟢 Spring City Boro (3 Sales): $395,833 | 101.85% | 31 days
Average Sold Price: $881,461
Sold Price-to-List Price: 103.64%
Cumulative Days on Market: 19
🟢 Easttown Twp (8 Sales): $1,382,625 | 101.88% | 41 days
🟢 Tredyffrin Twp (25 Sales): $721,088 | 104.20% | 13 days
Average Sold Price: $470,265
Sold Price-to-List Price: 97.95%
Cumulative Days on Market: 61
🟢 Elverson Boro (1 Sale): $413,000 | 104.58% | 3 days
🟢 Honeybrook Twp (7 Sales): $474,235 | 96.94% | 79 days
🟢 West Nantmeal Twp (3 Sales): $480,088 | 98.09% | 40 days
Average Sold Price: $864,330
Sold Price-to-List Price: 99.91%
Cumulative Days on Market: 47
🟢 Birmingham Twp (6 Sales): $857,800 | 98.99% | 59 days
🟢 Pennsbury Twp (2 Sales): $994,750 | 102.47% | 5 days
🟢 Pocopson Twp (1 Sale): $650,000 | 96.30% | 97 days
🟢 West Marlboro Twp (1 Sale): $857,000 | 103.88% | 4 days
Average Sold Price: $780,636
Sold Price-to-List Price: 101.40%
Cumulative Days on Market: 15
🟢 E Bradford Twp (7 Sales): $837,879 | 102.67% | 5 days
🟢 E Goshen Twp (16 Sales): $562,469 | 101.32% | 30 days
🟢 West Chester Boro (6 Sales): $535,917 | 104.33% | 7 days
🟢 West Goshen Twp (27 Sales): $922,553 | 100.12% | 12 days
🟢 West Whiteland Twp (18 Sales): $852,669 | 101.44% | 13 days
🟢 Westtown Twp (8 Sales): $709,375 | 102.42% | 13 days
• https://www.tragorealty.com/#subscribe
The table presented as an image below visually represents the same sales data that is listed in the bullet points above. The table format organizes the information into rows and columns, which can sometimes make it easier to comprehend at a glance. However, the image-based table might be less accessible or clear for readers on mobile devices compared to the text-based bulleted list. Please reach out for a PDF version of the table to be emailed.

In summary, the Chester County residential real estate market in March 2025 showed increased activity, higher prices, and faster sales compared to February, continuing the trend of a competitive market.
Please feel free to reach out if you have any questions or would like a more detailed analysis of specific areas.
*All information in this report has been collected from Bright MLS and is deemed reliable but not guaranteed. The Broker makes no representations or warranties, express or implied, regarding the accuracy, completeness, or reliability of the data provided. This information is subject to errors, omissions, and data entry inaccuracies, including but not limited to those from cooperating brokers participating in Bright MLS. Additionally, this report does not account for off-market transactions, private sales, or transactions conducted outside of Bright MLS.
This report is for informational purposes only and should not be construed as real estate advice. Individual circumstances vary, and real estate decisions should be based on professional guidance tailored to your specific situation. Please contact Trago Realty or your real estate agent to discuss your particular situation and/or needs.
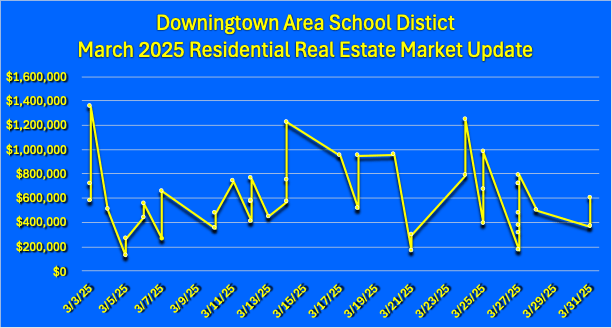
Welcome to the March 2025 Downingtown Area School District Real Estate Market Update. As the market continues to evolve, March data reflects a highly competitive landscape, with strong demand and limited supply defining current conditions.
In this report, we’ll break down essential market indicators such as median and average sales prices, sale price-to-original price ratios, and financing trends. The market remains dynamic, with a limited number of financing options. Additionally, transaction details are organized by township to offer a deeper understanding of market activity. Whether you're looking to buy, sell, lease or invest, or simply stay informed, these insights may help you better understand the competitive Downingtown real estate landscape. To understand how these trends impact your real estate goals, call Trago Realty today for a personalized consultation.
Homes in the Downingtown Area School District are moving quickly, with a median of just five days on the market. The sale price-to-original list price ratio stands at 101.6%, underscoring that most homes are selling at or above asking price. However, 22 properties required price reductions, selling at an average of 95.67% of their original list price.
With just a three-month supply of inventory, the market remains firmly in seller’s territory, characterized by strong competition among buyers. Financing trends indicate that conventional loans dominated at 76.19%, while 16.67% of buyers paid in cash.
The Downingtown Area School District’s residential real estate market remained active in March 2025. Below are key statistics for the month:
• Current Price Average: $858,242
• Current Price Median: $667,129
• Months Supply of Inventory: 3 months
• Sale Price-to-Original Price Ratio: 101.6%
• Days to Sell Average: 19 days
• Days to Sell Median: 5 days
• Cumulative Days on Market Average: 21 days
• Cumulative Days on Market Median: 5 days
• Number of Price Reductions: 22
• Reduced Price-to-Original Ask Ratio Average: 95.67%
• Reduced Price-to-Original Ask Ratio Median: 96.33%
• Number of Closed Sales: 42
Mortgage & Payment Types
• Cash Sales: 16.67%
• Conventional Financing: 76.19%
• FHA: 2.38%
• Other: 4.76%
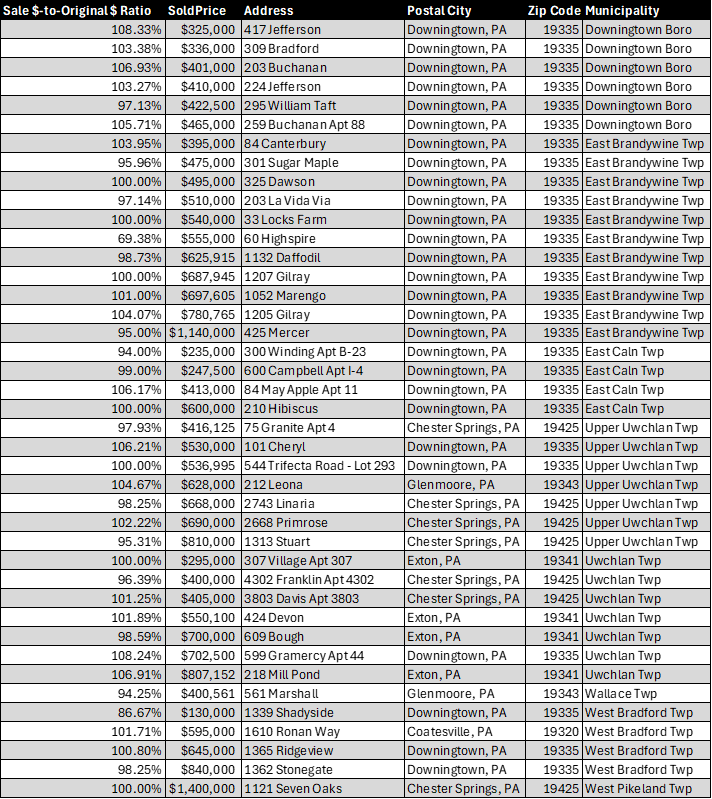
The following list of closed transactions in the Downingtown Area School District, includes their sale-to-list price ratios, sale prices, and locations.
Downingtown Borough (Zip Code: 19335)
• 100.00% of Original List Price: $170,000, 335 E Lancaster Apt B-25
• 112.81% of Original List Price: $265,000, 130 Brandywine
• 103.33% of Original List Price: $310,000, 10 Downing
• 100.00% of Original List Price: $410,000, 423 Highland
• 104.41% of Original List Price: $480,300, 231 Roosevelt Apt 101
East Brandywine Township (Zip Code: 19335)
• 88.99% of Original List Price: $169,000, 18 Melissa
• 103.55% of Original List Price: $295,000, 7 Wyndham Apt 7
• 100.00% of Original List Price: $500,000, 1103 Hopewell
• 100.13% of Original List Price: $580,735, 1051 Marengo
• 104.46% of Original List Price: $658,110, 1212 Gilray
• 102.04% of Original List Price: $750,000, 340 S Caldwell
• 98.02% of Original List Price: $762,570, 1213 Gilray
• 86.36% of Original List Price: $950,000, 141 Crawford
• 103.51% of Original List Price: $957,500, 49 Colleen
• 84.48% of Original List Price: $1,225,000, 14 Patterdale
East Caln Township (Zip Code: 19335)
• 87.81% of Original List Price: $377,500, 79 Gunning Apt 30
• 110.00% of Original List Price: $440,000, 64 May Apple Apt 83
• 106.32% of Original List Price: $505,000, 35 Kennedy
• 91.20% of Original List Price: $570,000, 782 Southwind
• 100.00% of Original List Price: $575,000, 36 Woodland
Upper Uwchlan Township
Zip Code: 19335 - Downingtown
• 103.07% of Original List Price: $556,500, 110 Marsh Creek
• 92.94% of Original List Price: $790,000, 660 Little Conestoga
Zip Code: 19425 - Chester Springs
• 94.38% of Original List Price: $722,000, 327 Dartmouth
• 100.00% of Original List Price: $980,000, 414 Hemlock
Zip Code: 19343 - Glenmoore
• 113.64% of Original List Price: $1,250,000, 117 Fawn
Uwchlan Township
Zip Code: 19341 - Exton
• 101.89% of Original List Price: $270,000, 217 Village Walk Apt 217
• 102.82% of Original List Price: $365,000, 1802 Worthington Apt 1802
• 105.95% of Original List Price: $392,000, 142 Neyland
• 106.43% of Original List Price: $787,500, 731 Brooke
Zip Code: 19335 - Downingtown
• 103.64% of Original List Price: $570,000, 579 Westwood
• 98.62% of Original List Price: $715,000, 890 Williamsburg
• 101.37% of Original List Price: $740,000, 803 Robert Dean
Wallace Township (Zip Code: 19343)
• 99.56% of Original List Price: $448,000, 180 Indiantown
• 132.89% of Original List Price: $1,353,899, 408 New Waynesburg
West Bradford Township
Zip Code: 19380 - West Chester
• 92.59% of Original List Price: $125,000, 1036 Pine
• 103.00% of Original List Price: $515,000, 734 Sugars Bridge
Zip Code: 19335 - Downingtown
• 118.31% of Original List Price: $601,000, 1424 Federal
• 103.08% of Original List Price: $670,000, 1336 Westminster
Zip Code: 19320 - Coatesville
• 103.60% of Original List Price: $720,000, 2036 Arrowhead
West Pikeland Township (Zip Code: 19425)
• 98.96% of Original List Price: $475,000, 324 Welsh
• https://www.tragorealty.com/#subscribe
The table presented as an image below visually represents the same sales data that is listed in the bullet points above. The table format organizes the information into rows and columns, which can sometimes make it easier to comprehend at a glance. However, the image-based table might be less accessible or clear for readers on mobile devices compared to the text-based bulleted list. Please reach out for a PDF version of the table to be emailed.

*All information in this report has been collected from Bright MLS and is deemed reliable but not guaranteed. The Broker makes no representations or warranties, express or implied, regarding the accuracy, completeness, or reliability of the data provided. This information is subject to errors, omissions, and data entry inaccuracies, including but not limited to those from cooperating brokers participating in Bright MLS. Additionally, this report does not account for off-market transactions, private sales, or transactions conducted outside of Bright MLS.
This report is for informational purposes only and should not be construed as real estate advice. Individual circumstances vary, and real estate decisions should be based on professional guidance tailored to your specific situation. Please contact Trago Realty or your real estate agent to discuss your particular situation and/or needs.

This month, we're seeing a vibrant and competitive housing market, characterized by quick sales and strong demand. With median days on market at just five and homes selling above their original listing prices on average, it's clear that the West Chester area remains a highly desirable location.
In this report, we'll delve into the key statistics that define the current market, including average and median prices, inventory levels, and financing trends. We've also compiled a comprehensive list of closed transactions, organized by township, to provide you with a detailed overview of recent sales activity. Whether you're looking to buy, sell, lease or invest, or simply stay informed, this report offers valuable insights that may help you better understand the dynamic West Chester Area School District market. To understand how these trends impact your real estate goals, call Trago Realty today for a personalized consultation.
The West Chester Area School District’s housing market remained competitive in March, with homes selling quickly—median days on the market were just five. The sale price-to-original price ratio stood strong at 101.1%, indicating that most homes sold very close to their asking price. Thirty-one properties required price reductions, at an average of 95.19% of their original list price.
With only a three-month supply of inventory, the market is still experiencing low levels of inventory in a sellers' market. Conventional financing dominated at 57.89%, while 39.47% of buyers paid in cash.
The West Chester Area School District’s residential real estate market remained active in March 2025. Below are key statistics for the month:
• Current Price Average: $929,363
• Current Price Median: $780,000
• Months Supply of Inventory: 3 months
• Sale Price-to-Original Price Ratio: 101.1%
• Days to Sell Average: 14 days
• Days to Sell Median: 5 days
• Cumulative Days on Market Average: 19 days
• Cumulative Days on Market Median: 5 days
• Number of Price Reductions: 31
• Reduced Price-to-Original Ask Ratio Average: 95.19%
• Reduced Price-to-Original Ask Ratio Median: 95.65%
• Number of Closed Sales: 76
• Cash Sales: 39.47%
• Conventional Financing: 57.89%
• FHA: 1.32%
• PHFA: 1.32%
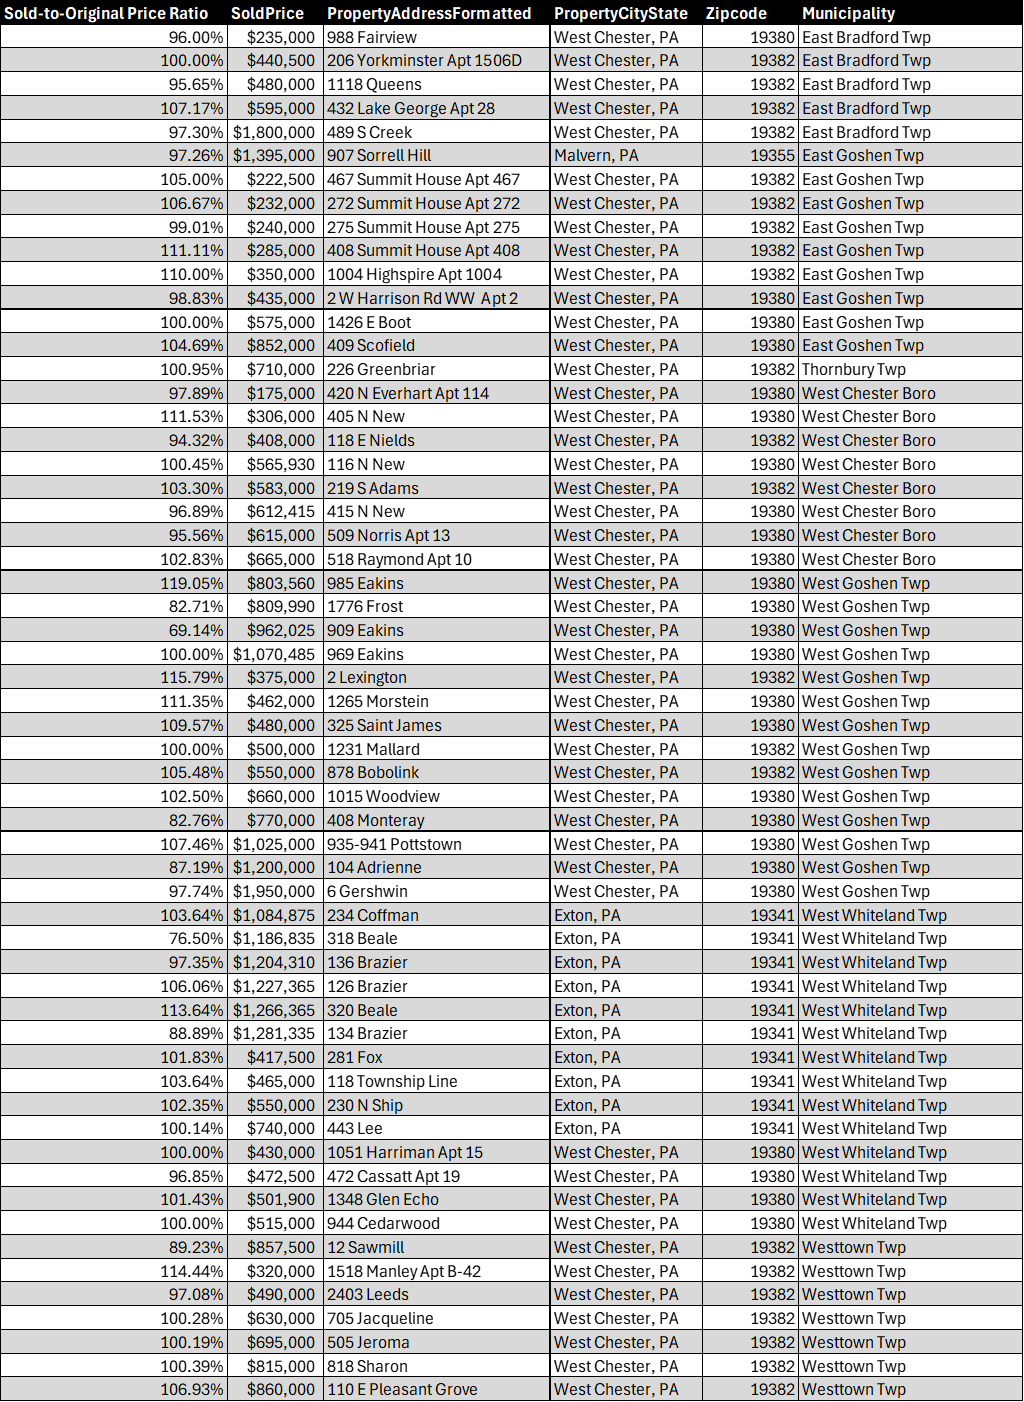
Below is a list of closed transactions in the West Chester Area School District, including their sale-to-list price ratios, sale prices, and locations.
• 101.38% of Original List Price: $304,150, 736 Scotch Apt C-31
• 100.00% of Original List Price: $625,000, 1135 Mews Apt 21
• 98.59% of Original List Price: $690,000, 342 Star Tavern
• 103.71% of Original List Price: $726,000, 715 Mercers Mill Apt 801
• 101.67% of Original List Price: $915,000, 216 Wencin
• 111.43% of Original List Price: $975,000, 813 Happy Creek
• 101.88% of Original List Price: $1,630,000, 940 Hillsdale
• 97.64% of Original List Price: $207,000, 505 Summit House Apt 505
• 90.74% of Original List Price: $245,000, 207 Walnut Hill Apt 22
• 92.31% of Original List Price: $300,000, 142 Summit House Apt 142
• 97.49% of Original List Price: $350,000, 53 Ashton Apt 53
• 98.04% of Original List Price: $500,000, 957 Kennett Apt 957
• 105.02% of Original List Price: $525,000, 765 Inverness Apt 765
• 102.32% of Original List Price: $530,000, 233 Chatham Apt 233
• 107.29% of Original List Price: $590,000, 590 Franklin Apt 590
• 107.04% of Original List Price: $610,000, 638 Glenwood Apt 638
• 100.00% of Original List Price: $625,000, 1475 Quaker Ridge Apt 1475
• 98.60% of Original List Price: $626,000, 30 Reservoir
• 104.22% of Original List Price: $667,000, 531 Franklin Apt 531
• 100.00% of Original List Price: $750,000, 51 Lochwood
• 104.68% of Original List Price: $816,500, 1229 Waterford
• 102.14% of Original List Price: $817,000, 801 Irene
• 113.65% of Original List Price: $841,000, 1524 High Meadow
• 84.17% of Original List Price: $420,000, 11 Long
• 104.00% of Original List Price: $780,000, 72 Old Barn Dr
• 96.36% of Original List Price: $1,060,000, 63 Cherry Farm
• 107.94% of Original List Price: $340,000, 705 S Penn
• 107.78% of Original List Price: $485,000, 340 E Miner
• 100.00% of Original List Price: $515,000, 201 Debaptiste
• 98.21% of Original List Price: $550,000, 403 N New
• 99.20% of Original List Price: $620,000, 501 E Union
• 112.88% of Original List Price: $705,500, 421 Dean
• 98.67% of Original List Price: $370,000, 750 E Marshall Apt 211
• 81.65% of Original List Price: $400,000, 1130 Grove
• 101.82% of Original List Price: $447,000, 212 Longford
Zip Code: 19380 - West Chester
• 100.24% of Original List Price: $411,000, 746 Chessie Apt 43
Zip Code: 19341 - Exton
• 100.00% of Original List Price: $450,000, 37 Buttonwood Apt 37
• 100.00% of Original List Price: $459,500, 521 Pewter Apt 521
Zip Code: 19382 - West Chester
• 103.53% of Original List Price: $440,000, 533 Coventry
• 108.51% of Original List Price: $650,000, 312 Oakbourne
• 104.01% of Original List Price: $780,000, 1122 Cardinal
• 95.35% of Original List Price: $800,000, 609 W Pleasant Grove
• 108.36% of Original List Price: $920,000, 1131 Talleyrand
Zip Code: 19342 Glen Mills
• 97.62% of Original List Price: $610,000, 1116 Butternut (Glen Mills)
• https://www.tragorealty.com/#subscribe
The table presented as an image below visually represents the same sales data that is listed in the bullet points above. The table format organizes the information into rows and columns, which can sometimes make it easier to comprehend at a glance. However, the image-based table might be less accessible or clear for readers on mobile devices compared to the text-based bulleted list. Please reach out for a PDF version of the table to be emailed.

*All information in this report has been collected from Bright MLS and is deemed reliable but not guaranteed. The Broker makes no representations or warranties, express or implied, regarding the accuracy, completeness, or reliability of the data provided. This information is subject to errors, omissions, and data entry inaccuracies, including but not limited to those from cooperating brokers participating in Bright MLS. Additionally, this report does not account for off-market transactions, private sales, or transactions conducted outside of Bright MLS.
This report is for informational purposes only and should not be construed as real estate advice. Individual circumstances vary, and real estate decisions should be based on professional guidance tailored to your specific situation. Please contact Trago Realty or your real estate agent to discuss your particular situation and/or needs.

Welcome to the March 2025 Coatesville Area School District Real Estate Market Update! This month’s report provides a comprehensive overview of the local housing market, highlighting key trends and valuable insights for buyers and sellers. Despite ongoing inventory constraints, homes continue to sell quickly, with a median of just 9 days on the market.
In this report, we’ll break down essential market indicators such as median and average sales prices, sale price-to-original price ratios, and financing trends. The market remains dynamic, with a variety of financing options reflecting a diverse pool of buyers. Additionally, transaction details are organized by township to offer a deeper understanding of market activity. Whether you're looking to buy, sell, lease or invest, or simply stay informed, these insights may help you better understand the competitive Coatesville real estate landscape. To understand how these trends impact your real estate goals, call Trago Realty today for a personalized consultation.
The Coatesville Area School District housing market remained strong and competitive throughout March, with homes selling rapidly—median days on the market held steady at 9. The sale price-to-original price ratio stood at 99.4%, indicating that most properties sold very close to their asking prices. However, 19 properties required price reductions, with an adjusted reduced price-to-original ask ratio averaging 95.95%.
With only a two-month supply of inventory, the market continues to favor sellers. Conventional financing was the most common payment method, making up 54.84% of transactions, while 30.65% of buyers opted for cash purchases. The remaining sales were financed through a mixture of USDA, FHA, VA, Private Financing and Adjustable-Rate Mortgages. The financing information is self-reported by the listing agents, therefore it may be reflective of how the purchase agreement was structured, but not necessarily guaranteed of how the final financing occurred at settlement.
The Coatesville Area School District’s residential real estate market remained active in March 2025. Below are key statistics for the month:
• Current Price Average: $478,719
• Current Price Median: $400,000
• Months’ Supply of Inventory: 2 months
• Sale Price-to-Original Price Ratio: 99.40%
• Days to Sell Average: 26 days
• Days to Sell Median: 9 days
• Cumulative Days on Market Average: 28 days
• Cumulative Days on Market Median: 9 days
• Number of Price Reductions: 19
• Reduced Price-to-Original Ask Ratio Average: 95.95%
• Reduced Price-to-Original Ask Ratio Median: 96.97%
• Number of Closed Sales: 62
• Cash Sales: 30.65%
• Conventional Financing: 54.84%
• FHA Financing: 6.45%
• VA Financing: 4.84%
• Adjustable Rate Mortgage Financing: 1.61%
• Private: 1.61%
Below is a list of closed transactions in the Coatesville Area School District, including their sale-to-list price ratios, sale prices, and locations.
• https://www.tragorealty.com/#subscribe
The table presented as an image below visually represents the same sales data that is listed in the bullet points above. The table format organizes the information into rows and columns, which can sometimes make it easier to comprehend at a glance. However, the image-based table might be less accessible or clear for readers on mobile devices compared to the text-based bulleted list. Please reach out for a PDF version of the table to be emailed.

*All information in this report has been collected from Bright MLS and is deemed reliable but not guaranteed. The Broker makes no representations or warranties, express or implied, regarding the accuracy, completeness, or reliability of the data provided. This information is subject to errors, omissions, and data entry inaccuracies, including but not limited to those from cooperating brokers participating in Bright MLS. Additionally, this report does not account for off-market transactions, private sales, or transactions conducted outside of Bright MLS.
This report is for informational purposes only and should not be construed as real estate advice. Individual circumstances vary, and real estate decisions should be based on professional guidance tailored to your specific situation. Please contact Trago Realty or your real estate agent to discuss your particular situation and/or needs.

April is recognized as National Fair Housing Month—a time to reflect on the ideals of fairness and equal access to housing. At the time this blog post was written in 2025, federally, there are seven protected classes under the Fair Housing Act (US Dept. of HUD: https://www.hud.gov/helping-americans/fair-housing-act-overview): race, color, national origin, religion, sex (including gender identity and sexual orientation), familial status, and disability.
In Pennsylvania, the Pennsylvania Human Relations Act (PHRA) extends protections even further, covering up to 12 classes, including (PA Dept of Community & Economic Development Fair Housing In PA: https://dced.pa.gov/housing-and-development/fair-housing/):
One area that may deserve more exploration is age. Under current Pennsylvania law, individuals under the age of 40 may not be protected from housing discrimination based solely on age. This raises an interesting question:
Should adults aged 18 and older be protected under state law in the same way those 40 and older are?
Especially when it comes to housing access for college students and young renters, this question might become even more relevant.
Municipalities such as West Chester Borough—home to West Chester University—enforce policies like student rental permitting. While such policies may be intended to maintain neighborhood balance or control density, they might also create certain unintended consequences that disproportionately affect student renters and the broader rental market.
For example:
Of course, not all municipalities enforce these policies in the same way, and not all students experience housing insecurity. But in some markets, the cumulative effect may be driving up costs while limiting options for both tenants and property owners.
While much of the national conversation around student loan debt focuses on tuition, it may be worth considering how rising housing costs—especially in college towns—may also be contributing to the student debt burden. In municipalities with restricted student housing options or limited permit availability, rental prices for student-eligible properties can become inflated due to high demand and constrained supply.
When landlords are able to charge a premium for properties with student rental permits, it’s possible that students are absorbing those higher costs—often with financial aid, federal student loans or private student loans. In these scenarios, students aren’t just borrowing to pay for books and classes; they may also be borrowing to afford rent that’s been elevated by municipal regulation or market distortion.
This pattern could be one of several factors that contribute to the ongoing student loan crisis:
While more data is needed to draw direct correlations, it’s worth examining whether housing policies that limit student access to rentals are inadvertently encouraging greater reliance on debt—and whether that reliance might be quietly exacerbating the student loan crisis.
Lawmakers in Pennsylvania have proposed pieces of legislation that may help to address some of these housing challenges for students.
View Memo →
Introduced by Rep. Susan Helm (R-104), HB 809 proposed limiting the authority of local governments to prohibit the occupation of a dwelling by students or unrelated individuals. The bill suggests that:
Helm noted that municipalities may have valid concerns about health, safety, or quality of life—but targeting individuals based on their student status or relationship structure may not be the most equitable solution.
This proposal might offer a more consistent, statewide approach to housing policy while still allowing municipalities to address legitimate issues through neutral standards.
View Memo →
Introduced by Rep. Joe Ciresi (D-146), HB 121 aims to support student renters by requiring:
The idea here is that when students are equipped with practical knowledge, they may be more prepared to identify unsafe housing conditions or unfair treatment. If implemented effectively, this could contribute to better outcomes for both student renters and landlords.
From a broader perspective, policies that limit who can live where—based on age, student status, and/or family structure—may deserve deeper scrutiny. Students are often legal adults, yet they may encounter barriers to housing access that older adults do not.
Likewise, property owners who wish to rent to students might face unique restrictions that affect the value or use of their real estate. In some cases, this could alter market dynamics in ways that might not benefit renters, landlords, or long-term residents.
Perhaps there’s room for policy adjustments that better balance community interests with individual rights and economic opportunity.
A Question of Perspective: Applying the Fair Housing Lens
Consider this: if you were to say the statement listed below:
And into that blank you inserted any one of the other federally protected classes—race, color, national origin, religion, sex (including gender identity and sexual orientation), familial status, or disability—it would likely be immediately recognized as a discriminatory housing practice.
When a municipality or a landlord places restrictions specifically targeting "students", it's worth reflecting on whether this practice, while perhaps not directly analogous to discrimination based on those protected characteristics, similarly limits housing access for a specific group of adults based on their status. Viewing the policy through the lens of the Fair Housing Act's fundamental principles of equal access might lead to a different perspective on policies like student rental permitting.
National Fair Housing Month gives us an opportunity to reflect on what fair access really means. Some questions worth asking:
These issues may not have simple answers. But asking the questions, encouraging dialogue, and supporting thoughtful legislation might be a good place to start.
• https://www.tragorealty.com/#subscribe
This blog post is intended as an opinion piece and does not constitute legal advice. Readers are encouraged to explore the resources of the Department of Housing and Urban Development ("HUD") and Pennsylvania Human Relations Commission, speak with a real estate and/or housing attorney, or contact your local elected officials for further guidance on tenant rights and housing regulations.
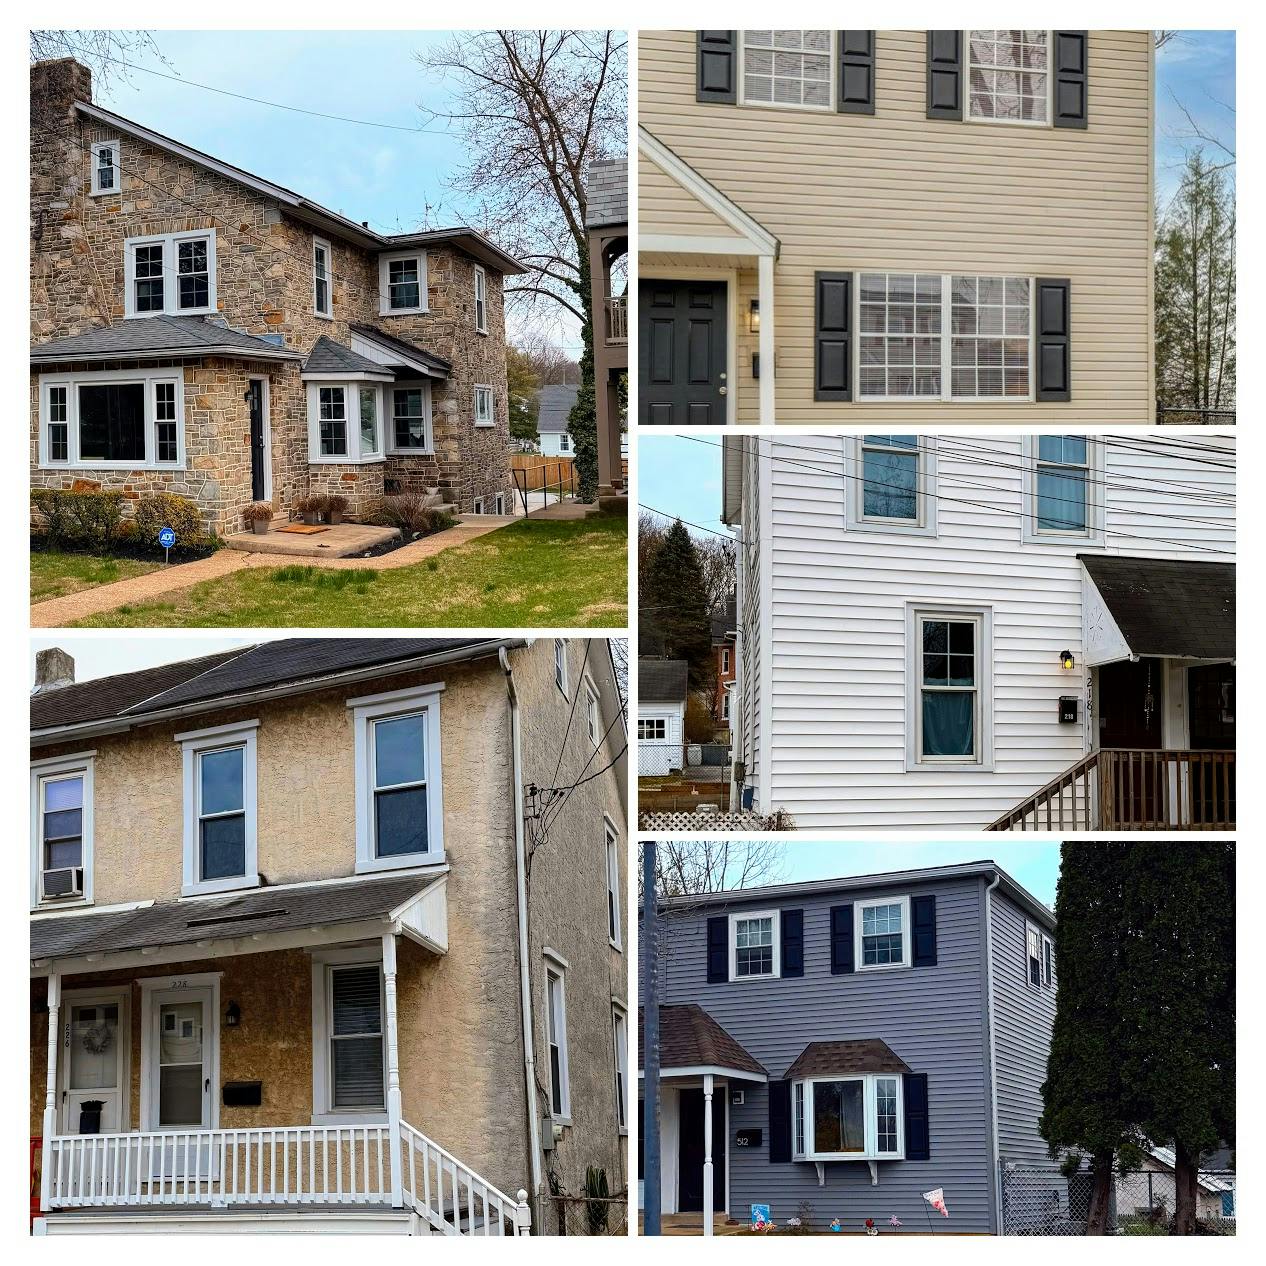
The old adage “Location, Location, Location” is a fundamental truth in real estate. Of course it would be, right? After all home’s location is fixed—it doesn’t change.
In this case, all of the properties analyzed are within Downingtown Borough, meaning their location is relatively the same. However, location alone doesn’t determine price. Condition is the key variable, and as the sales below illustrate, it can cause significant differences in price—even between nearly identical homes.
Two twin homes, just 0.1 miles apart, sold at noticeably different prices, from what I can tell due to condition.
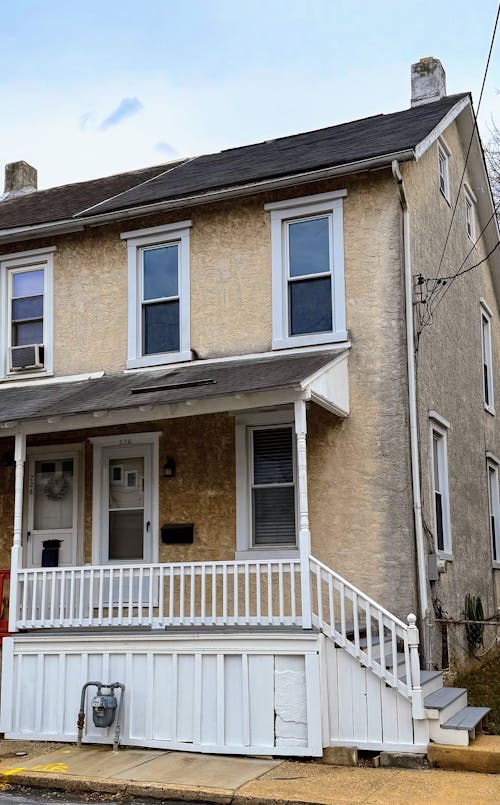
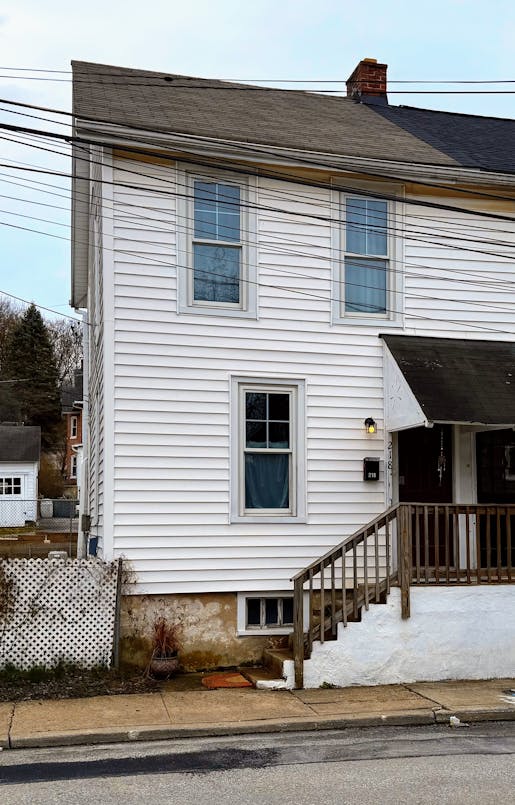
Both homes offered similar layouts and locations, yet 218 William St. commanded $38,000 more simply because it required fewer immediate repairs.
Two identical twin homes on Grant Ave—just 210 feet apart—show the financial impact of condition on pricing.
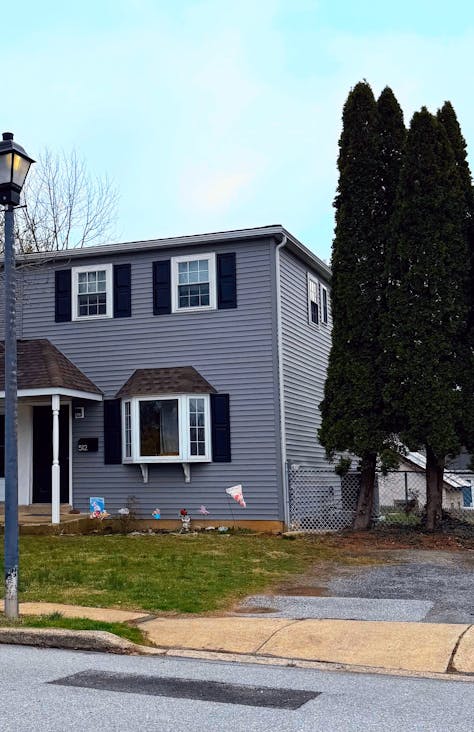

Despite having the same layout, 523 Grant Ave sold for $124,000 more because it was fully renovated, offering buyers a turn-key home with updates.
This property sold twice in under a year, proving how improvements directly impact market value.
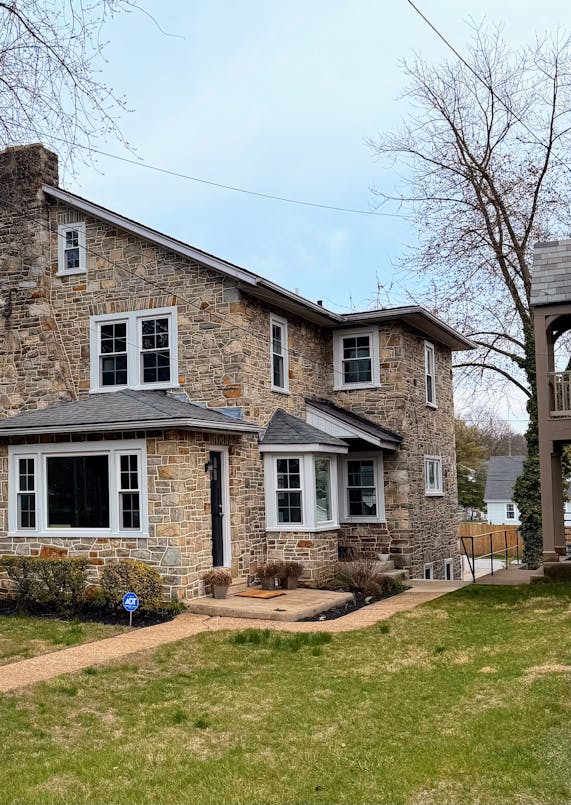
After undergoing renovations—including an added bedroom, half bathroom, and upgraded finishes—the property sold for $169,500 more in just seven months.
Every home in this analysis shares the same fundamental factor: location. However, it seems evident that prices vary based on condition. While location establishes the baseline for desirability, condition can significantly influence pricing.
Each home and situation is unique. If you're considering selling, reach out to one of our agents to discuss how, or if, your home could benefit from repairs and updates before listing.
• https://www.tragorealty.com/#subscribe
Disclaimer:
The information provided is not guaranteed, nor does the broker warrant the accuracy of the data. Results are not guaranteed, as market conditions, economic factors, interest rates, and inventory levels all play a role in the successful sale of a home. This blog post shall not be construed as a broker opinion of value or a comparative market analysis. Any statements regarding home values, pricing influences, or market trends are for informational, and entertainment, purposes only and should not be relied upon as financial, legal, or real estate advice. Buyers and sellers should consult with a licensed real estate professional for guidance specific to their situation.

Welcome to the February 2025 Chester County Residential Rental Market Report! This month, we're taking a closer look at the evolving landscape of rentals across the county's diverse school districts. Whether you're a landlord seeking to maximize your investment, a renter searching for the perfect home, or an investor tracking market trends, this report provides valuable insights. We'll explore key metrics like average rent prices, the number of rentals available, and how quickly properties are moving off the market (Cumulative Days on Market - CDOM). Understanding these trends will help you navigate the Chester County rental market effectively. Dive in for a detailed overview, and be sure to check out the comprehensive table at the end of this post for a complete breakdown!
Please feel free to sign-up for our Newsletter to stay tuned in for next month’s market update to track trends and see how the spring market shapes up!
The rental market in Chester County, PA, continues to evolve, with significant differences in price and market activity across various school districts. Whether you're a landlord, investor, or renter, understanding these trends can help you make informed decisions. Below, we dive into the latest statistics, examining the number of rentals, average rent prices, and the average cumulative days on market (CDOM) for each school district.
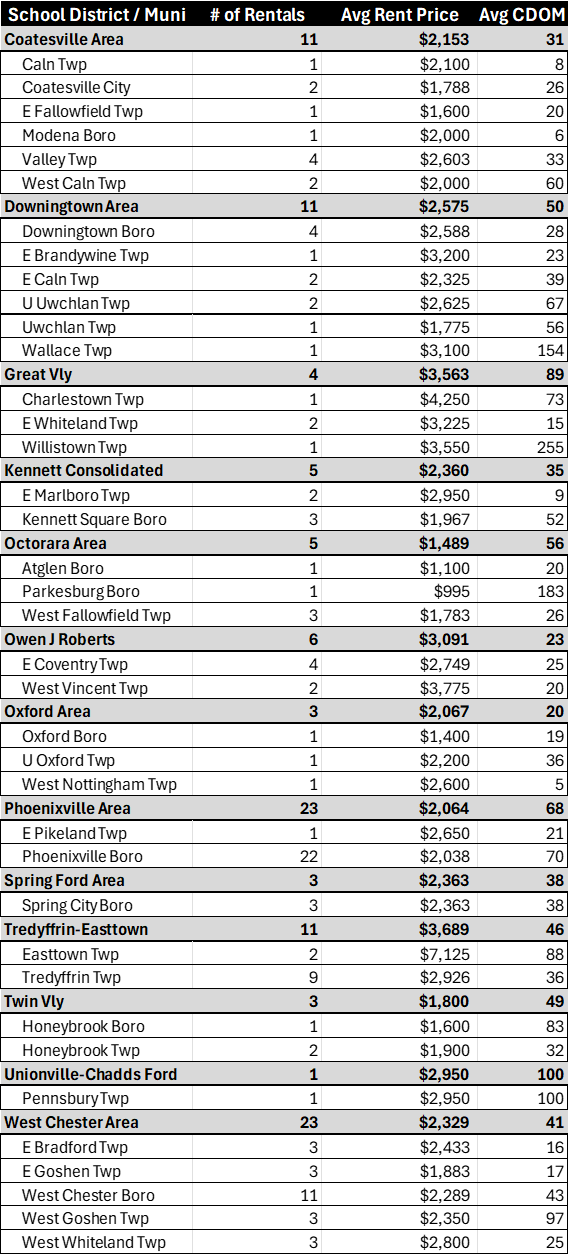
Note* From Left-to-Right: Column 1: School District with corresponding Townships & Municipalities, Column 2: Number of Rentals, Column 3: Average Rent Price and Column 4: Average Cumulative Days on Market.
The Chester County rental market offers a wide range of options depending on location, price, and market activity. Some areas, like Tredyffrin-Easttown and Great Valley, command premium rents, while districts like Octorara and Coatesville provide more affordable alternatives. Market times also vary greatly, with some properties moving quickly and others lingering for months. Whether you’re looking to rent or invest, understanding these dynamics is crucial in making the right decision.
Looking for more insights into the Chester County real estate market? Stay tuned for our monthly updates and expert analysis!
*All information in this report has been collected from Bright MLS and is deemed reliable but not guaranteed. The Broker makes no representations or warranties, express or implied, regarding the accuracy, completeness, or reliability of the data provided. This information is subject to errors, omissions, and data entry inaccuracies, including but not limited to those from cooperating brokers participating in Bright MLS. Additionally, this report does not account for off-market transactions, private sales, or transactions conducted outside of Bright MLS.
This report is for informational purposes only and should not be construed as real estate advice. Individual circumstances vary, and real estate decisions should be based on professional guidance tailored to your specific situation. Please contact Trago Realty or your real estate agent to discuss your particular needs.

Welcome to the February 2025 Chester County Real Estate Market Update! This month's report provides a comprehensive overview of the county's active housing market. We're seeing a trend of homes selling quickly, with a median of just nine days on the market, indicating strong buyer demand. While most homes sold near their asking price, strategic pricing remains crucial, as price reductions were a factor in many transactions. This report dives into key metrics including average and median sale prices, days on market, and financing trends, offering valuable insights for anyone looking to navigate the Chester County real estate scene. Explore the details below to understand the dynamics of this sellers' market and how it might impact your real estate goals.
Please feel free to sign-up for our Newsletter to stay tuned in for next month’s market update to track trends and see how the spring market shapes up!
The Chester County’s housing market remained competitive in February, with homes selling quickly—median days on the market were just nine. The sale price-to-original price ratio stood strong at 99.45%, indicating that most homes sold very close to their asking price. A total of 123 properties required price reductions, ultimately selling at an average of 94.14% of their original list price. This highlights the importance of strategic pricing from the start to avoid prolonged market time and potential further reductions.
With only a four-month supply of inventory, the market is still experiencing low levels of inventory in a sellers' market. Conventional financing dominated at 71.24%, while 24.75% of buyers paid in cash.
The Chester County’s residential real estate market remained active in February 2025. Below are key statistics for the month:
Chester County, PA Real Estate Market Activity - February 2025
Franklin Twp (1 Sale): $610,000, 96.39%, 58 Days
London Britain Twp (2 Sales): $750,000, 100.02%, 15 Days
London Grove Twp (4 Sales): $550,000, 94.63%, 45 Days
New London Twp (2 Sales): $497,450, 98.18%, 18 Days
Penn Twp (2 Sales): $527,280, 101.66%, 43 Days
West Grove Boro (1 Sale): $350,000, 102.97%, 17 Days
Caln Twp (11 Sales): $341,127, 100.51%, 18 Days
Coatesville City (3 Sales): $202,333, 96.56%, 4 Days
E Fallowfield Twp (3 Sales): $366,333, 100.88%, 33 Days
Sadsbury Twp (2 Sales): $440,500, 99.02%, 6 Days
South Coatesville Boro (1 Sale): $355,000, 98.61%, 18 Days
Valley Twp (17 Sales): $345,186, 95.82%, 41 Days
West Brandywine Twp (3 Sales): $475,333, 101.67%, 15 Days
West Caln Twp (4 Sales): $359,123, 97.40%, 38 Days
Downingtown Boro (6 Sales): $393,250, 104.13%, 6 Days
E Brandywine Twp (11 Sales): $627,475, 96.84%, 34 Days
E Caln Twp (4 Sales): $373,875, 99.79%, 48 Days
U Uwchlan Twp (7 Sales): $611,303, 100.66%, 32 Days
Uwchlan Twp (7 Sales): $551,393, 101.90%, 6 Days
Wallace Twp (1 Sale): $400,561, 94.25%, 10 Days
West Bradford Twp (4 Sales): $552,500, 96.85%, 8 Days
West Pikeland Twp (1 Sale): $1,400,000, 100.00%, 2 Days
Charlestown Twp (5 Sales): $1,052,000, 95.34%, 53 Days
E Whiteland Twp (11 Sales): $648,591, 100.71%, 34 Days
Malvern Boro (3 Sales): $808,333, 96.36%, 71 Days
Willistown Twp (8 Sales): $903,053, 104.11%, 6 Days
E Marlboro Twp (4 Sales): $717,500, 91.52%, 24 Days
Kennett Square Boro (1 Sale): $275,000, 100.00%, 5 Days
Kennett Twp (1 Sale): $660,000, 91.03%, 67 Days
New Garden Twp (3 Sales): $400,000, 73.24%, 38 Days
Atglen Boro (4 Sales): $445,355, 100.45%, 71 Days
Londonderry Twp (6 Sales): $558,461, 114.74%, 50 Days
Parkesburg Boro (1 Sale): $410,000, 102.50%, 3 Days
West Fallowfield Twp (2 Sales): $526,500, 81.55%, 46 Days
E Coventry Twp (1 Sale): $389,000, 105.73%, 7 Days
Nantmeal Twp (1 Sale): $1,975,000, 82.29%, 283 Days
E Vincent Twp (1 Sale): $400,000, 105.43%, 31 Days
N Coventry Twp (3 Sales): $607,667, 101.17%, 13 Days
S Coventry Twp (4 Sales): $306,100, 94.31%, 48 Days
West Vincent Twp (2 Sales): $852,500, 104.67%, 52 Days
E Nottingham Twp (4 Sales): $576,760, 110.11%, 11 Days
Lower Oxford Twp (4 Sales): $359,418, 96.58%, 98 Days
Oxford Boro (2 Sales): $422,450, 101.29%, 32 Days
West Nottingham Twp (2 Sales): $375,000, 100.50%, 16 Days
E Pikeland Twp (2 Sales): $587,500, 103.58%, 3 Days
Phoenixville Boro (11 Sales): $484,444, 101.14%, 24 Days
Schuylkill Twp (3 Sales): $751,633, 96.76%, 43 Days
Spring City Boro (2 Sales): $350,000, 100.03%, 54 Days
Easttown Twp (3 Sales): $1,404,667, 106.59%, 4 Days
Tredyffrin Twp (18 Sales): $801,092, 97.46%, 38 Days
Elverson Boro (3 Sales): $455,833, 98.38%, 16 Days
Honey Brook Twp (8 Sales): $418,863, 103.77%, 19 Days
West Nantmeal Twp (2 Sales): $369,250, 109.00%, 33 Days
Birmingham Twp (1 Sale): $675,000, 96.43%, 63 Days
Pennsbury Twp (2 Sales): $497,500, 96.13%, 51 Days
Pocopson Twp (4 Sales): $941,250, 80.46%, 67 Days
West Marlboro Twp (1 Sale): $895,000, 100.00%, 0 Days
E Bradford Twp (5 Sales): $710,100, 92.51%, 62 Days
E Goshen Twp (9 Sales): $509,611, 97.59%, 47 Days
Thornbury Twp (1 Sale): $710,000, 101.43%, 96 Days
West Chester Boro (8 Sales): $491,293, 97.86%, 21 Days
West Goshen Twp (14 Sales): $829,861, 101.88%, 17 Days
West Whiteland Twp (14 Sales): $810,213, 105.05%, 5 Days
Westtown Twp (7 Sales): $666,786, 100.24%, 35 Days
The table below replicates key real estate market metrics that are listed above, including the Number of Sales (# of Sales), Average Sold Price (Avg Sold Price), Sold-to-Original List Price Ratio (S/L $ Ratio), and Average Cumulative Days on Market (CDOM).
The data is organized first by school district, with each municipality that recorded sales listed beneath it, along with the corresponding market data points. Please note that two extreme outliers removed from the data-set below.
Please feel free to reach out for a copy of the table, in the event that you aren't able to clearly see the image.

*All information in this report has been collected from Bright MLS and is deemed reliable but not guaranteed. The Broker makes no representations or warranties, express or implied, regarding the accuracy, completeness, or reliability of the data provided. This information is subject to errors, omissions, and data entry inaccuracies, including but not limited to those from cooperating brokers participating in Bright MLS. Additionally, this report does not account for off-market transactions, private sales, or transactions conducted outside of Bright MLS.
This report is for informational purposes only and should not be construed as real estate advice. Individual circumstances vary, and real estate decisions should be based on professional guidance tailored to your specific situation. Please contact Trago Realty or your real estate agent to discuss your particular needs.

Welcome to the February 2025 Coatesville Area School District Real Estate Market Update! This month's report highlights a dynamic market with consistent activity and valuable insights for buyers and sellers alike. Despite limited inventory, homes are selling at a steady pace, with a median of just 15 days on the market. We'll explore the key metrics shaping the Coatesville area, including average and median prices, the sale price-to-original price ratio, and financing trends. Notably, this market sees a diverse range of financing options, indicating a varied buyer pool. Dive into the details of the closed transactions, organized by township, to understand the current landscape and make informed decisions in this competitive market.
Please feel free to sign-up for our Newsletter to stay tuned in for next month’s market update to track trends and see how the spring market shapes up!
The Coatesville Area School District’s housing market remained competitive in February, with homes selling quickly—median days on the market were just fifteen. The sale price-to-original price ratio stood strong at 98.13%, with two extreme outliers removed from the data-set, indicating that most homes sold close to their asking price. Thirteen properties required price reductions, at an average of 89.17% of their original list price.
With only a three-month supply of inventory, the market is still experiencing low levels of inventory in a sellers' market. Conventional financing dominated at 67.39%, while 21.74% of buyers paid in cash, the remaining sales where a blend of FHA, VA, USDA and Adjustable Rate Mortgages.
The Coatesville Area School District’s residential real estate market remained active in February 2025. Below are key statistics for the month:
• Current Price Average: $466,078
• Current Price Median: $399,900
• Months Supply of Inventory: 3 months
• Sale Price-to-Original Price Ratio: 98.14%
Note* Two extreme outliers were removed from the data-set for the Sale Price-to-Original Price Ratio
• Days to Sell Average: 30 days
• Days to Sell Median: 15 days
• Cumulative Days on Market Average: 33 days
• Cumulative Days on Market Median: 15 days
• Number of Price Reductions: 13
• Reduced Price-to-Original Ask Ratio Average: 89.17%
• Reduced Price-to-Original Ask Ratio Median: 96.42%
• Number of Closed Sales: 46
• Cash Sales: 21.74%
• Conventional Financing: 67.39%
• FHA Financing: 4.35%
• VA Financing: 2.17%
• USDA Financing: 2.17%
• Adjustable Rate Mortgage Financing: 2.17%
Below is a list of closed transactions in the Coatesville Area School District, including their sale-to-list price ratios, sale prices, and locations.
Below the bulleted list is a table of the same sales activity. Feel free to reach out for a copy of the table emailed to you that is larger.
Coatesville, PA Area Real Estate Sales Activity by Township
Caln Township (Zip Code: 19335 & 19320 & 19372)
Coatesville City (Zip Code: 19320)
East Fallowfield Township (Zip Code: 19320)
Sadsbury Township (Zip Code: 19320)
South Coatesville Boro (Zip Code: 19320)
Valley Township (Zip Code: 19320 & 19321)
West Brandywine Township (Zip Code: 19320 & 19343)
West Caln Township (Zip Code: 19320 & 19344)

*All information in this report has been collected from Bright MLS and is deemed reliable but not guaranteed. The Broker makes no representations or warranties, express or implied, regarding the accuracy, completeness, or reliability of the data provided. This information is subject to errors, omissions, and data entry inaccuracies, including but not limited to those from cooperating brokers participating in Bright MLS. Additionally, this report does not account for off-market transactions, private sales, or transactions conducted outside of Bright MLS.
This report is for informational purposes only and should not be construed as real estate advice. Individual circumstances vary, and real estate decisions should be based on professional guidance tailored to your specific situation. Please contact Trago Realty or your real estate agent to discuss your particular needs.

Welcome to the February 2025 West Chester Area School District Real Estate Market Update! This month, we're seeing a vibrant and competitive housing market, characterized by quick sales and strong demand. With median days on market at just six and homes selling very close to their original listing prices, it's clear that the West Chester area remains a highly desirable location. In this report, we'll delve into the key statistics that define the current market, including average and median prices, inventory levels, and financing trends. We've also compiled a comprehensive list of closed transactions, organized by township, to provide you with a detailed overview of recent sales activity. Whether you're a potential buyer, seller, or simply interested in the local real estate landscape, this report offers valuable insights into the dynamic West Chester Area School District market.
Please feel free to sign-up for our Newsletter to stay tuned in for next month’s market update to track trends and see how the spring market shapes up!
The West Chester Area School District’s housing market remained competitive in February, with homes selling quickly—median days on the market were just six. The sale price-to-original price ratio stood strong at 100.1%, indicating that most homes sold very close to their asking price. Eighteen properties required price reductions, at an average of 97% of their original list price.
With only a three-month supply of inventory, the market is still experiencing low levels of inventory in a sellers' market. Conventional financing dominated at 72.41%, while 27.59% of buyers paid in cash.
The West Chester Area School District’s residential real estate market remained active in February 2025. Below are key statistics for the month:
• Current Price Average: $969,479
• Current Price Median: $799,495
• Months Supply of Inventory: 3 months
• Sale Price-to-Original Price Ratio: 100.1%
• Days to Sell Average: 5 days
• Days to Sell Median: 6 days
• Cumulative Days on Market Average: 29 days
• Cumulative Days on Market Median: 5 days
• Number of Price Reductions: 18
• Reduced Price-to-Original Ask Ratio Average: 97%
• Reduced Price-to-Original Ask Ratio Median: 97.17%
• Number of Closed Sales: 58
Mortgage & Payment Types
• Cash Sales: 27.59%
• Conventional Financing: 72.41%
Below is a list of closed transactions in the West Chester Area School District, including their sale-to-list price ratios, sale prices, and locations.
West Chester, PA Area Real Estate Sales Activity by Township
East Bradford Township (Zip Code: 19380 & 19382)
East Goshen Township (Zip Code: 19380 & 19382)
Thornbury Township (Zip Code: 19382)
West Chester Boro (Zip Code: 19380 & 19382)
West Goshen Township (Zip Code: 19380 & 19382)
West Whiteland Township (Zip Code: 19341)
West Whiteland Township (Zip Code: 19380)
Westtown Township (Zip Code: 19382)
*All information in this report has been collected from Bright MLS and is deemed reliable but not guaranteed. The Broker makes no representations or warranties, express or implied, regarding the accuracy, completeness, or reliability of the data provided. This information is subject to errors, omissions, and data entry inaccuracies, including but not limited to those from cooperating brokers participating in Bright MLS. Additionally, this report does not account for off-market transactions, private sales, or transactions conducted outside of Bright MLS.
This report is for informational purposes only and should not be construed as real estate advice. Individual circumstances vary, and real estate decisions should be based on professional guidance tailored to your specific situation. Please contact Trago Realty or your real estate agent to discuss your particular needs.

Welcome to the February 2025 Downingtown Area School District Real Estate Market Update! As we move further into the new year, the local housing market continues to show strength and resilience. This month's data reveals a competitive landscape with quick sales, strong sale-to-list price ratios, and limited inventory. Whether you're a buyer, seller, or simply interested in the local market, this report provides valuable insights into the current trends shaping our community. We'll delve into key statistics, including average and median prices, days on market, and financing breakdowns, giving you a comprehensive overview of the market's performance. Plus, we've compiled a detailed list of closed sales, organized by township, to give you a clear picture of recent activity. Dive in to explore the February 2025 market and see how the Downingtown area is performing!
Please feel free to sign-up for our Newsletter to stay tuned for next month’s market update to track trends and see how the spring market shapes up!
The Downingtown Area School District’s housing market remained competitive in February, with homes selling quickly—median days on the market were just six. The sale price-to-original price ratio stood strong at 99.7%, indicating that most homes sold very close to their asking price. Nineteen properties required price reductions, at an average of 95.33% of their original list price.
With only a three-month supply of inventory, the market is still experiencing low levels of inventory in a sellers' market. Conventional financing dominated at 82.50%, while 17.50% of buyers paid in cash.
The Downingtown Area School District’s residential real estate market remained active in February 2025. Below are key statistics for the month:
Below is a list of closed transactions in the Downingtown Area School District, including their sale-to-list price ratios, sale prices, and locations.
Below the bulleted list is a table of the same sales activity. Feel free to reach out for a copy of the table emailed to you that is larger.
Downingtown, PA Real Estate Sales Activity by Township
Downingtown Boro (Zip Code: 19335)
East Brandywine Township (Zip Code: 19335)
East Caln Township (Zip Code: 19335)
Upper Uwchlan Township
Uwchlan Township (Zip Code: 19341)
Wallace Township (Zip Code: 19343)
West Bradford Township
West Pikeland Township (Zip Code: 19425)
*All information in this report has been collected from Bright MLS and is deemed reliable but not guaranteed. The Broker makes no representations or warranties, express or implied, regarding the accuracy, completeness, or reliability of the data provided. This information is subject to errors, omissions, and data entry inaccuracies, including but not limited to those from cooperating brokers participating in Bright MLS. Additionally, this report does not account for off-market transactions, private sales, or transactions conducted outside of Bright MLS.
This report is for informational purposes only and should not be construed as real estate advice. Individual circumstances vary, and real estate decisions should be based on professional guidance tailored to your specific situation. Please contact Trago Realty or your real estate agent to discuss your particular needs.

Subscribe to our Monthly Newsletter for Chester County, PA Real Estate Market Updates & Information.
Like, Subscribe and Follow any of our social media accounts. All links can be found at the top of our website.
Thanks for taking the time to visit this blog post! Enjoy the information!
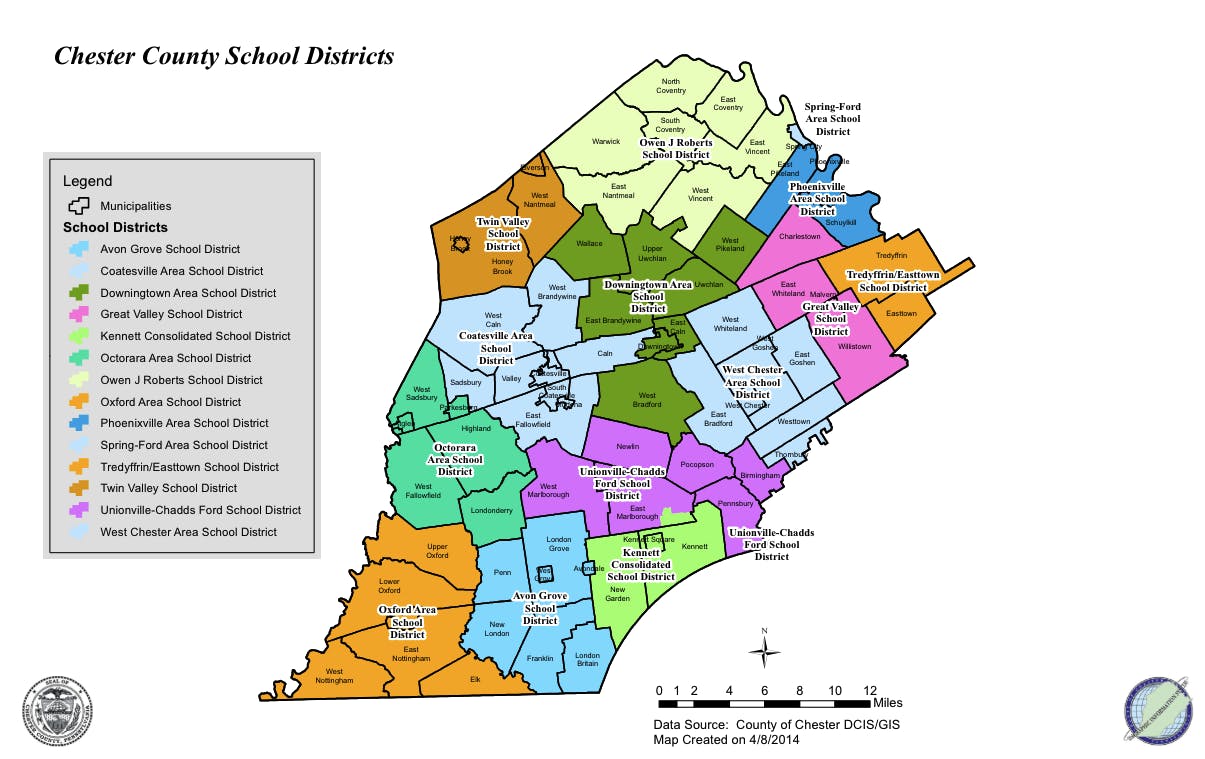
As mentioned in the blog post from July 10, 2024, titled "Using Chester County School Districts as Geographic Boundaries for Real Estate Searches", school district boundaries often play a significant role in real estate searches in Pennsylvania. These boundaries help buyers, whether owner occupants, investors and tenants identify areas that align with their specific needs and goals. Property values, rent prices, and appreciation rates can vary between districts, for that reason understanding the composition of Chester County's fourteen school districts is critical in making informed decisions related to each individual’s goals.
Rental rates in Chester County, Pennsylvania, can vary significantly based on location. Factors influencing these rates include property type, proximity to local attractions, including meals and entertainment, proximity and access to highways and public transportation, local school districts, property amenities and neighborhood amenities.
Understanding these variations is essential for both renters and investors. Renters can identify areas that fit their budget, while investors can pinpoint regions with targeted rental yields. Always consider local market trends and consult reliable sources to make informed rental decisions.
Shown below are a variety of tables illustrating the differences, and similarities, rental rates between school districts, and townships within school districts.


Based on information from Bright MLS. The data referenced includes residential lease properties in Chester County, PA, with a status of "Closed" from June 1, 2023, to June 3, 2024, resulting in 1,475 listings, some of which were excluded due to not being residential.
This information has been collected from resources deemed to be reliable, but guaranteed for accuracy. The broker, Trago Realty, does not guarantee the accuracy of the information provided. For the most current and detailed information about the respective schools, it is recommended that you contact the school districts directly.
Information in this post, and on www.tragorealty.com, is not to be construed as real estate, investing, legal, accounting, and/or insurance advice. Be sure to consult the respective specialist prior to making any decisions (e.g., real estate licensee, financial planner/advisor, attorney, CPA/tax advisor, and/or insurance agent/company).
Our website may contain links to external websites that are not provided or maintained by, or in any way affiliated with, www.tragorealty.com. Please note that www.tragorealty.com does not guarantee the accuracy, relevance, timeliness, or completeness of any information on these external websites.
By clicking on these links, you will be directed to a third-party site. These sites are not under the control of www.tragorealty.com, and we are not responsible for the content or accuracy of these external sites. The inclusion of any links does not necessarily imply a recommendation or endorse the views expressed within them.
You should be aware that when you leave our website, other sites may have different privacy policies and terms that are beyond our control. We strongly advise you to read the privacy policies and terms and conditions of any third-party sites that you visit.
Following these links is at your own risk, and we will not be liable for any damages or losses resulting from the use of external links.

Subscribe to our Monthly Newsletter for Chester County, PA Real Estate Market Updates & Information.
Like, Subscribe and Follow any of our social media accounts. All links can be found at the top of our website.
Thanks for taking the time to visit this blog post! Enjoy the information!
As mentioned in the blog post from July 10, 2024, titled "Using Chester County School Districts as Geographic Boundaries for Real Estate Searches", school district boundaries often play a significant role in real estate searches in Pennsylvania. These boundaries help buyers, whether owner occupants, investors and tenants identify areas that align with their specific needs and goals. Property values, rent prices, and appreciation rates can vary between districts, for that reason understanding the composition of Chester County's fourteen school districts is critical in making informed decisions related to each individual’s goals.
Sales Prices in Chester County, Pennsylvania, can vary significantly based on location. Factors influencing these rates include property type, proximity to local attractions, including meals and entertainment, proximity and access to highways and public transportation, local school districts, property amenities and neighborhood amenities.
Understanding these variations is essential for buyers, whether owner-occupants or investors. Owner-occupants can identify areas that fit their budget, while investors can pinpoint regions with targeted rental yields. Always consider local market trends and consult reliable sources to make informed buying and investment decisions.
Shown below are a variety of tables illustrating the differences, and similarities of sales prices between school districts, and townships within school districts.


Based on information from Bright MLS. The data referenced includes residential lease properties in Chester County, PA, with a status of "Closed" from June 1, 2023, to June 3, 2024, resulting in 1,475 listings, some of which were excluded due to not being residential.
This information has been collected from resources deemed to be reliable, but guaranteed for accuracy. The broker, Trago Realty, does not guarantee the accuracy of the information provided. For the most current and detailed information about the respective schools, it is recommended that you contact the school districts directly.
Information in this post, and on www.tragorealty.com, is not to be construed as real estate, investing, legal, accounting, and/or insurance advice. Be sure to consult the respective specialist prior to making any decisions (e.g., real estate licensee, financial planner/advisor, attorney, CPA/tax advisor, and/or insurance agent/company).
Our website may contain links to external websites that are not provided or maintained by, or in any way affiliated with, www.tragorealty.com. Please note that www.tragorealty.com does not guarantee the accuracy, relevance, timeliness, or completeness of any information on these external websites.
By clicking on these links, you will be directed to a third-party site. These sites are not under the control of www.tragorealty.com, and we are not responsible for the content or accuracy of these external sites. The inclusion of any links does not necessarily imply a recommendation or endorse the views expressed within them.
You should be aware that when you leave our website, other sites may have different privacy policies and terms that are beyond our control. We strongly advise you to read the privacy policies and terms and conditions of any third-party sites that you visit.
Following these links is at your own risk, and we will not be liable for any damages or losses resulting from the use of external links.
Subscribe to our Monthly Newsletter for Chester County, PA Real Estate Market Updates & Information.
Like, Subscribe and Follow any of our social media accounts. All links can be found at the top of our website.
Thanks for taking the time to visit this blog post! Enjoy the information!
When residential owner occupants, tenants and investors are searching for real estate in Chester County, Pennsylvania, it's common for them to place a lot of weight on the school district. These boundaries can help define areas that meet buyers or tenants specific needs and goals, whether for personal residence or for making a strategic investment. Therefore, an understanding of what municipalities make-up each district can be critical.
While people may have preferences towards one school district over another, for various reasons, a buyer or tenant should never rely on the opinion of a real estate agent for the quality, or perceived quality, of education provided. That real estate licensee should probably also refrain from providing opinions on the perceived public perception of each district, whether good, bad or indifferent. Instead, the buyer or tenant should exercise their own due diligence and only rely on the real estate agent to quantify both, the differences between the varying districts in terms of the buyers budget and interpreting market data for levels of inventory, speed of sale, sold-to-list price ratios, number of sales and historical rates of appreciation/depreciation.
Understanding the municipality composition of each of the fourteen (14) Chester County school districts that are either headquartered in the county, or crossover into the county, can be helpful in navigating your property search.
Municipalities:
Municipalities:
Municipalities:
Municipalities:
Municipalities:
Municipalities:
Municipalities:
Municipalities:
Municipalities:
Municipality in Chester County:
Municipalities:
Municipalities in Chester County:
Municipalities:
Municipalities:
Understanding the school districts in Chester County is essential for making informed real estate decisions. Whether you are looking for a personal residence or considering the investment potential of a property, knowing which school district a property is located in can significantly influence your choice. School districts provide a useful framework for defining search areas and achieving your particular goals. For the most current and detailed information about the respective schools, we recommend contacting the school districts directly.
This information has been collected from resources deemed to be reliable, but guaranteed for accuracy. The broker, Trago Realty, does not guarantee the accuracy of the information provided. For the most current and detailed information about the respective schools, it is recommended that you contact the school districts directly.
Information in this post, and on www.tragorealty.com, is not to be construed as real estate, investing, legal, accounting, and/or insurance advice. Be sure to consult the respective specialist prior to making any decisions (e.g., real estate licensee, financial planner/advisor, attorney, CPA/tax advisor, and/or insurance agent/company).
Our website may contain links to external websites that are not provided or maintained by, or in any way affiliated with, www.tragorealty.com. Please note that www.tragorealty.com does not guarantee the accuracy, relevance, timeliness, or completeness of any information on these external websites.
By clicking on these links, you will be directed to a third-party site. These sites are not under the control of www.tragorealty.com, and we are not responsible for the content or accuracy of these external sites. The inclusion of any links does not necessarily imply a recommendation or endorse the views expressed within them.
You should be aware that when you leave our website, other sites may have different privacy policies and terms that are beyond our control. We strongly advise you to read the privacy policies and terms and conditions of any third-party sites that you visit.
Following these links is at your own risk, and we will not be liable for any damages or losses resulting from the use of external links.

Entering the realm of real estate can feel like stepping into a whirlwind, especially when deciphering signs that hold promises of opportunities and dreams. In Pennsylvania, real estate Sellers and Landlords grapple with a unique challenge—multiple telephone numbers and names crammed onto a single sign that happens to be in front of their listing. Let's delve into this practice and explore why simplicity plays a crucial role in effective marketing.
In the dynamic landscape of real estate, the inclusion of personal branding raises important considerations. While personal identity and brand recognition are valuable, they should not overshadow the core objective of effectively marketing and transacting real estate properties. Striking a balance between personal branding and compliance with legal requirements is essential to maintain professionalism and trust within the industry.
In a competitive real estate market, clarity and accessibility are paramount. By prioritizing simplicity and clear communication, we aim to make the selling and leasing experience as straightforward and rewarding as possible for our clients. Say goodbye to confusion and hello to a more efficient way of connecting buyers and tenants with your property.
Disclaimer:
The content provided in this blog post is for informational and entertainment purposes only. It should not be construed as Real Estate, Legal, Accounting, Financial, Insurance, and/or Construction advice. Each individual situation is unique, and readers are encouraged to consult the respective specialist for their specific needs.
While efforts have been made to ensure the accuracy of the information presented, we do not guarantee its accuracy. All information was collected from sources deemed to be reliable; however, we do not warrant the accuracy of that information. Readers are advised to conduct their own research and verification before making any decisions or taking actions based on the content of this blog post.
https://tragorealty.com/

If I were to ask you who is the McDonald’s of real estate, what company comes to mind? Great, I agree! There is no right or wrong answer, other than the answer that comes to mind.
When it comes to real estate, the appeal of brand recognition can sometimes distract from essential considerations when choosing a licensee to represent your interests effectively. If you're unsure about the unique value proposition of the licensee or brokerage you've interviewed, whether it's boutique or franchised, you might not be making a fully informed decision. Asking yourself if there's something you might be overlooking can be the key to making the best choice for yourself.
If you’re signing an agency contract with a real estate licensee with brand recognition as a key part of your decision making, you could be making a mistake!
This isn’t a blog post that’s going to trash franchised real estate brokerages. After all, a big chunk of my career was spent with the largest residential real estate brokerage by sales production and agent count in Chester County, which of course happened to be a franchise.
My intent is only to educate people that real estate franchises are vastly different from other franchised businesses, like restaurants. Sure, the Restaurant and Real Estate franchisors share similarities in the sense that both provide systems and processes to the franchisees, but the things that are provided to the customer or client can be totally different.
You see, if you as a consumer go to a McDonald’s in California, it’s not going to be a whole lot different than a McDonald’s here in Pennsylvania. That’s because the consistency of quality control is supposed to flow through to the customer.
However, if you go to two real estate agents from the same franchise office here in Pennsylvania, you’re likely to get two totally different approaches and outcomes. That’s because the systems and processes delivered to the real estate franchisees are for their customers . . . THE REAL ESTATE AGENTS! Although some of these systems and processes are designed to equip the agents with the knowledge and skills they need to help their clients, one of the main focuses of the franchisee is to recruit, attract and retain as many licensees as possible. For that reason, the experience of the clients of each individual licensee varies from agent to agent, even within the same real estate brokerage.
Just like any career, people-are-people and we all possess different skill-sets, characteristics and experiences. Or more importantly two totally different levels of skill-sets and competencies. Perfect example is one agent may have 10 days of experience, whereas another may have 10 years of experience. The point being that not all practitioners are equal in ability and knowledge.
The fact of the matter is, that we, boutique brokerages and franchise brokerages, in a lot of ways are more alike than different.
SIMILARITIES:
While both boutique and national franchise brokerages share similarities, there are distinct advantages to choosing a boutique brokerage. These include a more personalized approach, greater flexibility, and a unique atmosphere that fosters closer relationships between agents and clients. Prospective clients are encouraged to weigh these benefits when deciding which brokerage aligns best with their needs and preferences.